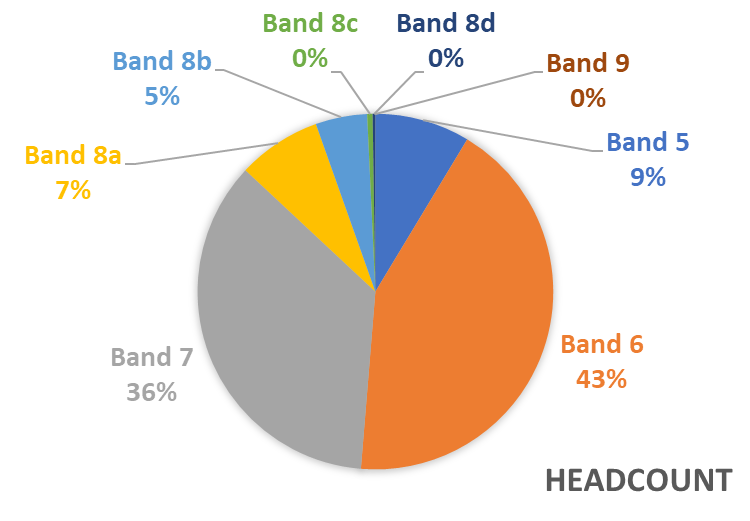
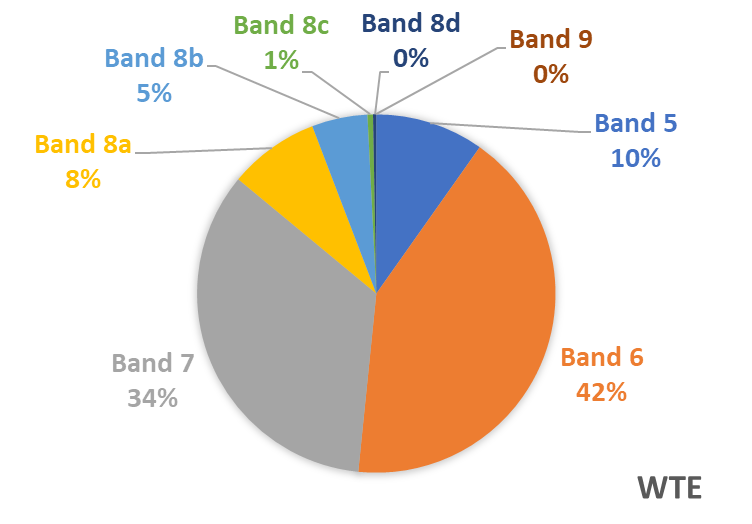
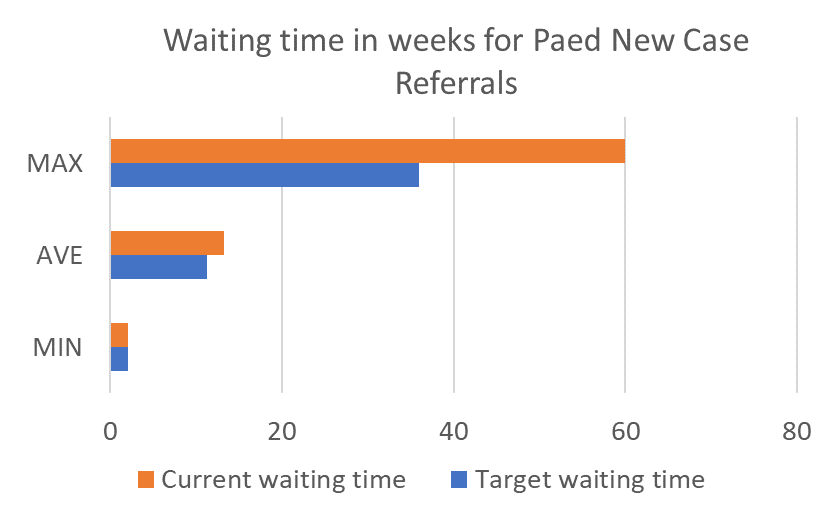
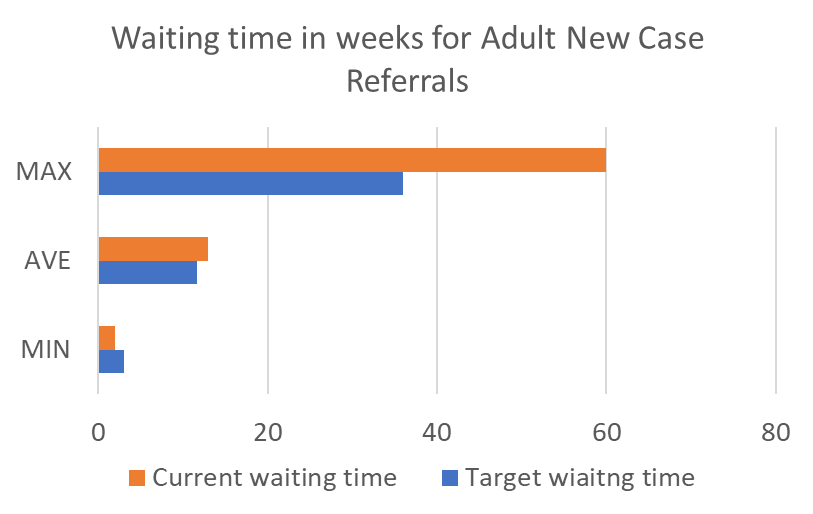
Below you will find summary data for the BIOS Workforce Survey 2023
- 139 departments returned data, including 112 from England, 14 from Scotland, 8 from Wales and 5 from Northern Ireland.
- This covered 1,212 Orthoptic staff and a WTE of 1012.
- The survey was carried out in April 2023.
If members have any questions about this data, you can contact us at [email protected].
ORTHOPTIST STAFF VACANCIES APRIL 2023
| BAND | Band 5 | Band 6 | Band 7 | Band 8a | Band 8b | Band 8d | Total |
| VACANCIES AS % OF ESTABLISHMENT | 14.33% | 14.70% | 6.71% | 4.33% | 1.76% | 33.33% | 10.97% |
NEW POSTS
FINANCIAL YR 2022-23
| NEW POST AREA | HEADCOUNT | WTE |
| Diabetic Screening | 1 | 0.64 |
| Glaucoma | 2 | 1.30 |
| Neuro Ophthalmology | 4 | 2.70 |
| Orthoptics | 17 | 14.60 |
| Research | 1 | 0.27 |
| Special Educational Needs | 1 | 0.36 |
| Stroke | 10 | 8.11 |
FINANCIAL YR 2023-24
| NEW POST AREA | HEADCOUNT | WTE |
| IVT injector | 1 | 0.20 |
| Orthoptics | 3 | 2.80 |
| Biometry | 1 | 0.40 |
| Intra Vitreal Injections | 1 | 1.00 |
GRADUATE ORTHOPTIST RECRUITMENT FINANCIAL YEAR 2021-22
| HC % OF ALL | 4.70% | WTE % OF ALL | 5.20% | ||
| University | Headcount | WTE | Headcount Share | WTE Share | |
| Glasgow | 7 | 6.60 | 12.28% | 12.54% | |
| Liverpool | 31 | 28.04 | 54.39% | 53.26% | |
| Sheffield | 19 | 18.01 | 33.33% | 34.21% | |
| Total | 57 | 52.65 | |||
OVERALL IMPACT ON WORKFORCE
| RETIREMENT | -19 |
| OTHER LEAVERS | -26 |
| NEW POSTS | -36 |
| MATERNITY LEAVE | -65 |
| CAREER BREAK | -10 |
| SECONDMENT | -1 |
| EXTENDED UNPAID LEAVE | -3 |
| NEGATIVE EFFECT ON WORKFORCE NEED | -160 |
| DISESTABLISHED POSTS | 4 |
| OVERSEAS RECRUITMENT | 3 |
| NEW GRADUATES APPOINTED | 57 |
| MATERNITY LEAVE COVER | 43 |
| RETURNED TO PRACTICE | 6 |
| RETIRED THEN RETURNED TO PRACTICE | 9 |
| POSITIVE EFFECT ON WORKFORCE NEED | 122 |
OVERALL EFFECT ON WORKFORCE NEED |
-39 |
Please note the chart to the left is based on returns received. For a true picture 100% returns would be needed, however IF the number of questionnaires returned is considered statistically sufficient to suppose that the balance between Positive and Negative Impact would hold, the chart to the right gives an indication of the overall picture had 100% returns occured.
| RETIREMENT | -21 | ||
| OTHER LEAVERS | -29 | ||
| NEW POSTS | -40 | ||
| MATERNITY LEAVE | -72 | ||
| CAREER BREAK | -11 | ||
| SECONDMENT | -1 | ||
| EXTENDED UNPAID LEAVE | -3 | ||
| NEGATIVE EFFECT ON WORKFORCE NEED | -176 | ||
| DISESTABLISHED POSTS | 4 | ||
| OVERSEAS RECRUITMENT | 3 | ||
| NEW GRADUATES APPOINTED | 63 | ||
| MATERNITY LEAVE COVER | 47 | ||
| RETURNED TO PRACTICE | 7 | ||
| RETIRED THEN RETURNED TO PRACTICE | 10 | ||
| POSITIVE EFFECT ON WORKFORCE NEED | 134 | ||
OVERALL EFFECT ON WORKFORCE NEED |
-42 |
||
The difference between the overall vacancy figure and the in-year impact:
| Identified Vacancies | 2022-23 Identified Impact | Historical Vacancies |
| 126 | 39 | 87 |
